Machine Learning Linear Regression And Regularlization
Linear regression is a model to predict a variable based on independent variables. The model assumes linear relationship between dependent and independent variables. Below represents a simple linear regression equation.
y = a + c1x1 + c2x2
In above equation y is a dependent variable and x1,x2 are independent variables. a is a intercept, c1 and c2 are coefficients. In above equation, we are trying to predict y based on x1 and x2 variables.
In this post, I will do an example of linear regression and regularization using Maching Learning package H2o. H2o is a great library and offers lot of techniques right out of the box.
I will use students alcohol data which I downloaded from following UCI website...
archive.ics.uci.edu/ml/datasets/student+performance
Before we delve in to our data analysis, Make sure you have following installed and working...
In your R repl, lets import the H2o package.
library(h2o)
h2o.init()
Lets import our data file student-mat.csv
st_mat <- h2o.importFile('student-mat.csv')
Lets look at first two rows using head method.
head(st_mat,2)
Lets look at the column names also.
colnames(st_mat)
To check number of rows, we can do using h2o.nrow.
h2o.nrow(st_mat)
For linear regression, we should check how many columns are there. We can do with command h2o.ncol.
h2o.ncol(st_mat)
One of most important thing about linear regression is chosing the right set of independent variables for our dependent variable.
For our dependent variable which is the variable we want to predict, Lets us pick "Walc" which is column number 28.
Walc - weekend alcohol consumption (numeric: from 1 - very low to 5 - very high)
Basically we are trying to predict weekend alcohol consumption. Lets see which of the variables help us doing that.
To train our Linear regression model, let us split our data in the ratio of 80% to 20% using h2o.splitFrame.
students.splits <- h2o.splitFrame(data = st_mat, ratios = .8)
train <- students.splits[[1]]
valid <- students.splits[[2]]
Ok now we got our train and validation set separated.
y = 28
Lets take out Walc and Dalc (daily alcohol consumption) from our independent variables.
x=-match(c("Walc","Dalc"),names(st_mat))
Ok now let us run our linear regression model. For that we can use h2o.glm package. glm stands for generalized linear regression models.
H2o Generalized Linear Regression Model (GLM)
students.glm <- h2o.glm(x=x,y=y, training_frame = train,
                        validation_frame = valid,remove_collinear_columns = TRUE)
Ok since it is a small data set, the model just ran instantly.
Now we can print out the glm model coefficients using h2o.std_coef_plot
h2o.std_coef_plot(students.glm)
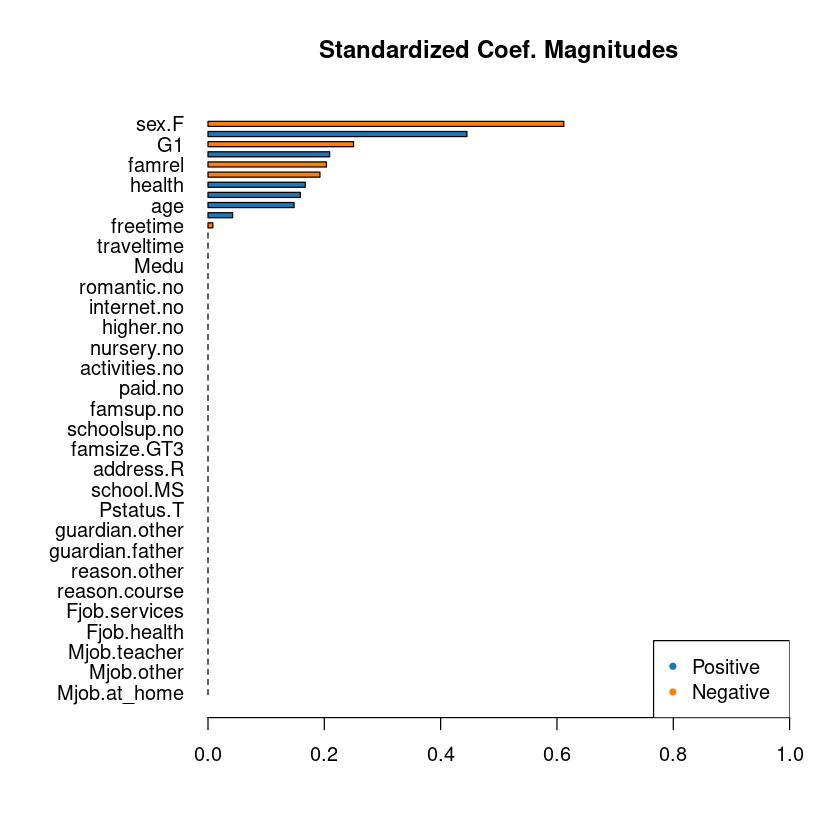
From the above graph we can look at the positive and negative parameters. Lets print the model coefficients to actually know their magnitudes.
Lets check which parameters are affecting positively to alcohol consumption.
We can use model$coefficients to access the coefficients of the variables of our linear regression.
coeff_vector = students.glm@model$coefficients
print(coeff_vector[coeff_vector > 0])
As we see above, other than intercept , age , failures, goout, health, absences, G2 (second period Grade) all affect positively.
Lets see if any parameters which affect the alcohol consumption negatively.
print(coeff_vector[coeff_vector < 0])
Female, studetime, famrel(quality of family relatives), freetime and (first period grade) all affect the weakly alcohol consumption negatively.
If we do model$model_summary, we can see which model type has been run by h2o default.
students.glm@model$model_summary
Above tables shows that regression type is "gaussian". Also the table shows regularization type which is Elastic Net.
Related Notebooks
- Lasso and Ridge Linear Regression Regularization
- Regularization Techniques in Linear Regression With Python
- Rectified Linear Unit For Artificial Neural Networks Part 1 Regression
- Understanding Logistic Regression Using Python
- How To Solve Linear Equations Using Sympy In Python
- How To Run Logistic Regression In R
- How To Add Regression Line On Ggplot
- Decision Tree Regression With Hyper Parameter Tuning In Python
- Python Iterators And Generators