Pivot Tables In Python Pandas
For this post, I will be using covid19 database from following link...
pomber.github.io/covid19/timeseries.json
Let us first import the necessary packages "requests and pandas".
import requests
import pandas as pd
import numpy as np
data = requests.get('https://pomber.github.io/covid19/timeseries.json')
We need to convert this data to the pandas dataframe so that we can build the pivot table.
jsondata = data.json()
columns=['country','date','confirmed','deaths','recovered']
data = []
for country in jsondata:
    for x in jsondata[country]:
        data.append([country, x['date'],x['confirmed'],x['deaths'],x['recovered']])
df = pd.DataFrame(data,columns=columns)
df.head(2)
Let us check the number of rows we have in our dataframe by using len(df)
len(df)
For every country, we have the data of corona virus cases by date.
How to create a pivot table in Python Pandas
Let us create a pivot table with respect to country. Remember we need to pass in the group key that is index for pivot table. Otherwise you would see following error...
ValueError: No group keys passed!
We can sum the numerical data of each country. To do that we can pass np.sum function to the pd.pivot_table().
pivoted = pd.pivot_table(df,index='country',aggfunc=np.sum)
Let us check the pivot table dataframe now.
pivoted.head(2)
Let us now create the pivot table with multiple indexes country and date.
pivoted_m = pd.pivot_table(df,index=['country','date'],aggfunc=np.sum)
pivoted_m.head(2)
Note, here passing the aggfunc=np.sum would not have any affect, since we are creating separate index for date. Therefore we can take out the aggregate function np.sum and result would still be the same.
pivoted_m = pd.pivot_table(df,index=['country','date'])
pivoted_m.head(2)
Pandas Pivot table count
We can count the number of times , We have data for any country. We just need to use the aggregate function 'count' as shown below.
pd.pivot_table(df,index=['country'],aggfunc='count').head(2)
Let us delete an entry and then run count aggregate function again to see if we get the result different. Let us delete the entry for Afghanistan for data 2020-1-22 which is row 0 in our original data frame. Let us drop the row 0 in our dataframe using df.drop method.
df.drop([0],inplace=True)
df.head(1)
Ok now our dataframe starts from row 1. Let us run the count aggregate function again.
pd.pivot_table(df,index=['country'],aggfunc='count').head(2)
There you go,we got a different count number for the country Aghanistan covid 19 cases.
How to access rows by multiple Indexes in Python Pivot Table
We can select the rows by the index name. Let us say we want to see covid19 cases of USA on date march 30. We can use Pandas loc function to select the row as shown below.
pivoted_m.loc['US','2020-3-30']
Our pivoted table has two levels. We can access the index level values by dataframe.index.levels function.
Let us access the level 0 which is country index and see how many countries we have in our dataframe.
len(pivoted_m.index.levels[0])
we have 187 countries in our dataframe.
Lets us check how many dates we have in our dataframe.
len(pivoted_m.index.levels[1])
So we have more than three months of corona virus cases worth of data.
Plot Python pivot table using Matplotlib
Let us see now, how we can plot the pivot tables data using matplotlib.
from matplotlib import pyplot as plt
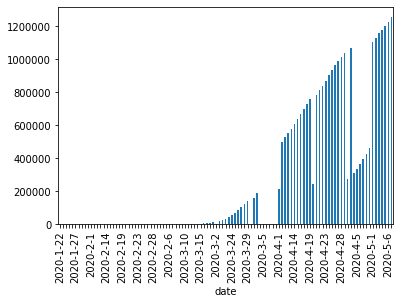
ax = pivoted_m.loc['US']['confirmed'].plot.bar()
for i, t in enumerate(ax.get_xticklabels()):
    if (i % 5) != 0:
        t.set_visible(False)
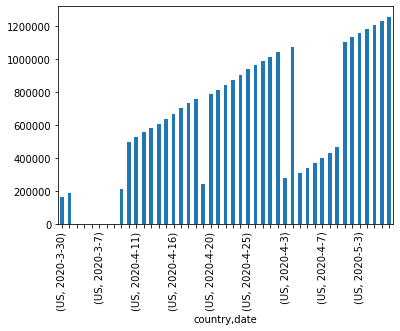
There were not enough cases in US before March 30, let us just filter the data to after march 30.
ax = pivoted_m.loc[('US', '2020-3-30'):('US', '2020-5-7')]['confirmed'].plot.bar()
for i, t in enumerate(ax.get_xticklabels()):
    if (i % 5) != 0:
        t.set_visible(False)
Wrap Up!
Pivot tables are very powerful data structure in Python Pandas. There is much more this that can be done with Python pivot tables.Related Notebooks
- How To Analyze Wikipedia Data Tables Using Python Pandas
- Summarising Aggregating and Grouping data in Python Pandas
- Merge and Join DataFrames with Pandas in Python
- Append In Python
- Dictionaries In Python
- How To Iterate Over Rows In A Dataframe In Pandas
- Activation Functions In Python
- SVM Sklearn In Python
- Set Operations In Python