How To Analyze Wikipedia Data Tables Using Python Pandas
In this post, I will show you how to plot graphs from the Wikipedia data tables.
I have copied data 'Press Freedom Index' from following page. 'Press Freedom Index' ranks Countries every year based on the Press Freedom. Lower the number better the Press Freedom.
en.wikipedia.org/wiki/Press_Freedom_Index
Lets first import following Python packages before doing the analysis.
import pandas as pd
from matplotlib.pyplot import hist
import seaborn as sns
import numpy as np
Our data is in following file 'journalism_index.csv'
df = pd.read_csv('journalism_index.csv')
Let us take a peek in to our data and see how it looks.
df.head(3)
As we see above, our data is shifted. Country and values are not aligned. We need to fix our data first.
Lets pick all the rows where Country value is NaN. We can filter out the rows using pd.isna as shown below.
dfi = df[pd.isna(df.Country)==True]
dfi.head(2)
Ok, as we see above, we got all the rows where Country is NaN. First row is not of any use. Lets drop that using dfi.drop
dfi.drop([0,0],inplace=True)
dfi.head(1)
Let us fix the index now using reset_index()
dfi = dfi.reset_index()
dfi.head(1)
dfi = dfi.drop(columns=['index'])
dfi.head(2)
Ok, we need to still do following steps.
- Replace Country Column with actual country names
Lets fix our country column first.
countries = df[pd.isna(df.Country)==False]['Country'].reset_index()['Country']
countries is a Panda Series. It contains all the country names. Lets take a look in to it.
countries.head()
type(countries)
Lets insert these countries in to our Pandas Dataframe. We will use dfi.loc method.
dfi.loc[:,'Country'] = countries
Let us look at our dataframe now.
dfi.head(5)
Let us check our dataframe again.
dfi.head(2)
Ok, It looks good now. Let us do some data analysis now.
Let us try to plot 'Press Freedom Index' for year 2019.
df_2019 = dfi[['Country','2019']]
df_2019.head(2)
df_2019.plot()
I got following error: TypeError: no numeric data to plot
We need to fix the data type of all columns. Lets make them numeric. We can do it using simple Python loop and pd.to_numeric method.
for col in dfi.columns:
    if col!='Country':
        dfi[col] = pd.to_numeric(dfi[col],errors='coerce')
Lets check the data type of column '2019' now.
dfi['2019'].head(1)
As we see above it is float64 now.
I have also noticed that, when we copy to spread sheet. The strings get extra spaces. Let us strip the space also using strip() in Pandas lambda function.
dfi['Country'] = dfi['Country'].map(lambda x: x.strip())
Ok, now we are ready to do some plotting.
import matplotlib.pyplot as plt
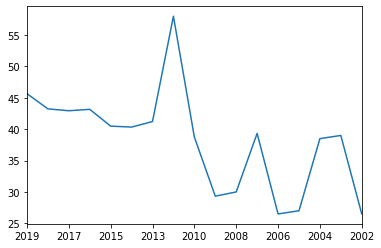
Lets plot the 'press freedom index' of country 'Finland' over all the years.
cname = 'Finland'
def scatterPlot(cname):
    dfi[dfi.Country==cname].set_index('Country').loc[cname].plot()
scatterPlot(cname)
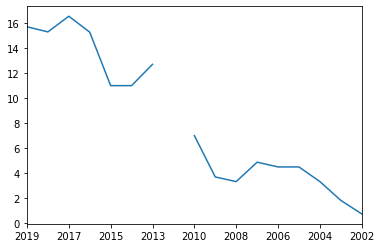
How about Canada?
cname = 'Canada'
scatterPlot(cname)
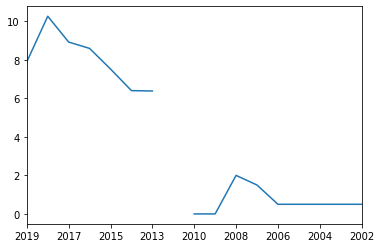
How about India?
cname = 'India'
scatterPlot(cname)
Let us compare the press freedom index of India and Pakistan over all the past years. To do that we need to use Pandas OR operator (|) to select multiple columns. Instead of line plot, we will do Pandas bar plot which will give us nice comparison.
dfi[(dfi.Country=='India') | (dfi.Country=='Pakistan')].set_index('Country').plot.bar().legend(loc='center left', bbox_to_anchor=(1, 0.5))
plt.axhline(y=50,linewidth=1, color='k')
plt.ylabel('Press Freedom Index')
plt.title('Press Freedom Index - lower is better')
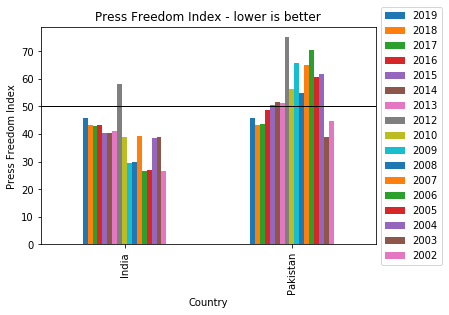
One can conlude from the above plot that over the years, both the countries are approaching the same in press freedom index.
Related Notebooks
- How To Analyze Data Using Pyspark RDD
- How to Analyze the CSV data in Pandas
- How To Analyze Yahoo Finance Data With R
- How To Read JSON Data Using Python Pandas
- How to Visualize Data Using Python - Matplotlib
- Pivot Tables In Python Pandas
- How to do SQL Select and Where Using Python Pandas
- How To Read CSV File Using Python PySpark
- Summarising Aggregating and Grouping data in Python Pandas