Max Pain is a theory that suggests that the price of an option contract will tend to move towards a certain strike price, known as the "max pain" strike price, before the option expires. The idea behind this theory is that the option strike price at which the most options will expire worthless is the strike price that causes the most "pain" to option holders.
In this post, we will get the data from Yahoo finance using yfinance Python package.
Let us do an example first. Let us download the option data for expiry 2023-02-03 for APPLE stock.
import yfinance as yf
import pandas as pd

# Get the options data for a stock
stock = yf.Ticker("AAPL")
options_chain = stock.option_chain(date='2023-02-03')
options_chain contains options_chain.calls and options_chain.puts method.
pd.DataFrame(options_chain.calls).head(1)
| contractSymbol | lastTradeDate | strike | lastPrice | bid | ask | change | percentChange | volume | openInterest | impliedVolatility | inTheMoney | contractSize | currency | |
|---|---|---|---|---|---|---|---|---|---|---|---|---|---|---|
| 0 | AAPL230203C00060000 | 2023-01-06 16:03:12+00:00 | 60.0 | 67.72 | 76.7 | 79.15 | 0.0 | 0.0 | 6.0 | 6 | 1.742189 | True | REGULAR | USD |
There is stock.options which contains all the expirationDates.
stock.options
('2023-01-27',
 '2023-02-03',
 '2023-02-10',
 '2023-02-17',
 '2023-02-24',
 '2023-03-03',
 '2023-03-17',
 '2023-04-21',
 '2023-05-19',
 '2023-06-16',
 '2023-07-21',
 '2023-08-18',
 '2023-09-15',
 '2023-10-20',
 '2023-12-15',
 '2024-01-19',
 '2024-03-15',
 '2024-06-21',
 '2025-01-17',
 '2025-06-20')
Let us try to find the max pain for TSLA options using formula given on investopedia.
To find the max pain price, for each in-the-money strike price for both puts and calls:
1. Calculate the difference between the stock price and the strike price.
2. Multiply that difference by the open interest at that strike.
3. Add the dollar value for the put and call at that strike.
4. Repeat steps 1-3 for each strike price. Identify the highest value strike price as the max pain price.
import yfinance as yf
import pandas as pd

# Define the stock ticker
ticker = "TSLA"
stockprice = 132.27

# Get the expiration dates for the stock options
expiration_dates = yf.Ticker(ticker).options

# Loop through each expiration date
for date in expiration_dates:
    # Get the option chain data for the current expiration date
    option_chain = yf.Ticker(ticker).option_chain(date)
    # Extract the put and call data
    puts = option_chain.puts
    calls = option_chain.calls
    # Combine the put and call data into a single dataframe
    data = pd.concat([puts, calls])
    # Filter for in-the-money options
    data = data[data['inTheMoney']]
    # Add a column for the difference between the stock price and strike price
    data['diff'] = abs(data['strike'] - stockprice)
    # Multiply the difference by the open interest
    data['dollar_value'] = data['diff'] * data['openInterest']
    # Extract the expiration date from the contractSymbol
    data['expirationDate'] = data['contractSymbol'].str[4:10]
    # Group by expiration date, strike price and sum the dollar value
    data = data.groupby(['expirationDate','strike']).sum()
    # Find the index of the maximum dollar value
    max_index = data['dollar_value'].idxmax()
    # Use the index to access the corresponding strike price
    max_pain_strike_price = max_index[1]
    maxpain.append({max_index[0]:max_pain_strike_price})
    #print("Expiration date:", max_index[0])
    #print("Max Pain Strike Price:", max_pain_strike_price)
maxpain
[{'230127': 160.0},
 {'230203': 160.0},
 {'230210': 165.0},
 {'230217': 105.0},
 {'230224': 114.0},
 {'230303': 160.0},
 {'230317': 200.0},
 {'230421': 80.0},
 {'230519': 110.0},
 {'230616': 1080.0},
 {'230721': 185.0},
 {'230915': 200.0},
 {'231215': 250.0},
 {'240119': 1800.0},
 {'240315': 200.0},
 {'240621': 1000.0},
 {'240920': 85.0},
 {'250117': 30.0},
 {'250620': 100.0},
 {'230127': 160.0},
 {'230203': 160.0},
 {'230210': 165.0},
 {'230217': 105.0},
 {'230224': 114.0},
 {'230303': 160.0},
 {'230317': 200.0},
 {'230421': 80.0},
 {'230519': 110.0},
 {'230616': 1080.0},
 {'230721': 185.0},
 {'230915': 200.0},
 {'231215': 250.0},
 {'240119': 1800.0},
 {'240315': 200.0},
 {'240621': 1000.0},
 {'240920': 85.0},
 {'250117': 30.0},
 {'250620': 100.0}]
You can also calculate the max pain strike price for a particular stock using pandas and the following steps:
Get the option chain data for the stock in question. This data should include the strike price, expiration date, and open interest for each option contract.
Group the option contracts by expiration date and strike price, and calculate the total open interest for each strike price. Instead of total open Interest, we can also take in account product of open interest and option price for each strike price
For each expiration date, find the strike price with the highest total open interest. This is the max pain strike price for that expiration date.
Plot the max pain strike prices for each expiration date to visualize the max pain theory.
import yfinance as yf
import pandas as pd

stock_ticker = "TSLA"

# Get the list of all available dates for the option chain data
dates = yf.Ticker(stock_ticker).options

# Initialize an empty DataFrame to store the option chain data
all_data = pd.DataFrame()

# Loop through all available dates
for date in dates:
    # Get the option chain data for the specific date
    option_chain = yf.Ticker(stock_ticker).option_chain(date=date)
    # convert the option chain data to a pandas dataframe
    df = option_chain.calls.append(option_chain.puts)
    # Extract the expiration date from the contractSymbol column
    df['Expiry'] = df['contractSymbol'].str[4:10]
    # Append the option chain data for the specific date to the all_data DataFrame
    all_data = all_data.append(df)

# Group option contracts by expiration date and strike price
grouped = all_data.groupby(['Expiry', 'strike'])['openInterest'].sum()
# Find the max pain strike price for each expiration date
max_pain = grouped.groupby(level=0).idxmax()
max_pain = max_pain.apply(lambda x: x[1])

# Plot max pain strike prices
max_pain.plot()
<AxesSubplot:xlabel='Expiry'>
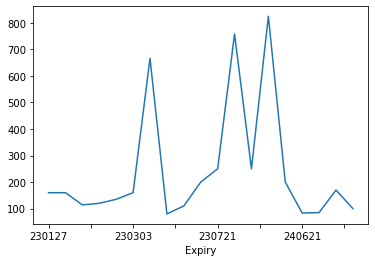
max_pain
Expiry
230127    160.00
230203    160.00
230210    114.00
230217    120.00
230224    135.00
230303    160.00
230317    666.67
230421     80.00
230519    110.00
230616    200.00
230721    250.00
230915    758.33
231215    250.00
240119    825.00
240315    200.00
240621     83.33
240920     85.00
250117    170.00
250620    100.00
Name: openInterest, dtype: float64
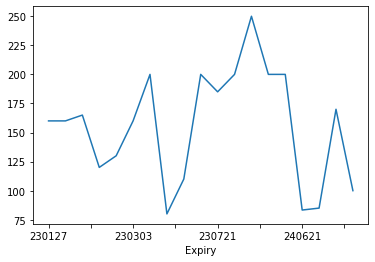
Note the above Code takes in to account sum of OpenInterest Number at each strike. Let us update the above code to take in to account following...
Instead of the sum of the OpenInterest at each strike, we will use sum of the product of option price and open interest at each strike price.
import pandas as pd
import yfinance as yf

ticker = "TSLA"
dates = yf.Ticker(ticker).options

# Initialize an empty list to store the option data
all_data = pd.DataFrame()

# Loop through each expiration date
for date in dates:
    # Retrieve the option chain for the current expiration date
    option_chain = yf.Ticker(ticker).option_chain(date=date)
    df = option_chain.calls.append(option_chain.puts)
    # Extract the expiration date from the contractSymbol column
    df = option_chain.calls.append(option_chain.puts)
    # Extract the expiration date from the contractSymbol column
    df['Expiry'] = df['contractSymbol'].str[4:10]
    # Append the option chain data for the specific date to the all_data DataFrame
    all_data = all_data.append(df)

# Create the pain column
all_data["pain"] = all_data["bid"] * all_data["openInterest"]

# Group option contracts by expiration date and strike price
grouped = all_data.groupby(['Expiry', 'strike'])['pain'].sum()
# Find the max pain strike price for each expiration date
max_pain = grouped.groupby(level=0).idxmax()
max_pain = max_pain.apply(lambda x: x[1])

# Plot max pain strike prices
max_pain.plot()
<AxesSubplot:xlabel='Expiry'>
all_data.head(1)
| contractSymbol | lastTradeDate | strike | lastPrice | bid | ask | change | percentChange | volume | openInterest | impliedVolatility | inTheMoney | contractSize | currency | Expiry | pain | |
|---|---|---|---|---|---|---|---|---|---|---|---|---|---|---|---|---|
| 0 | TSLA230127C00025000 | 2023-01-10 19:32:51+00:00 | 25.0 | 92.8 | 105.85 | 110.05 | 0.0 | 0.0 | 2.0 | 4.0 | 8.63477 | True | REGULAR | USD | 230127 | 423.4 |
max_pain
Expiry
230127    160.00
230203    160.00
230210    165.00
230217    120.00
230224    130.00
230303    160.00
230317    200.00
230421     80.00
230519    110.00
230616    200.00
230721    185.00
230915    200.00
231215    250.00
240119    200.00
240315    200.00
240621     83.33
240920     85.00
250117    170.00
250620    100.00
Name: pain, dtype: float64
Related Notebooks
- How To Analyze Yahoo Finance Data With R
- Demystifying Stock Options Vega Using Python
- Pandas Datareader To Download Stocks Data From Google And Yahoo Finance
- How To Parse Yahoo Finance News Feed With Python
- Plot Stock Options Vega Implied Volatility Using Python Matplotlib
- Calculate Implied Volatility of Stock Option Using Python
- Data Cleaning With Python Pdpipe
- Stock Sentiment Analysis Using Autoencoders
- How to Visualize Data Using Python - Matplotlib