How To Analyze Yahoo Finance Data With R
Analyzing Yahoo finance stock data with R is very straight forward.
We need following two packages.
- quantmod
- TTL
You can install above two packages in your R repl as shown below.
#install.packages('quantmod')
#install.packages('TTR')
library('TTR')
library('quantmod')
Ok now we can get the data from yahoo using getSymbols. Note auto.assign=False means, we want getSymbols to return back the data.
df_intc <- getSymbols('INTC',src='yahoo',auto.assign=FALSE)
Let us check the class of df_intc.
class(df_intc)
xts is a extensible time series package for time series data. xts is extension of the zoo class. xts data format is a special R matrix. To learn more about xts and zoo. check out following link...
rstudio-pubs-static.s3.amazonaws.com/288218_117e183e74964557a5da4fc5902fc671.html
Let us the check the number of rows in our data.
nrow(df_intc)
Now let us look at the last two rows in our data set.
tail(df_intc,2)
To plot xts data, we can use matplotlib's plot method.
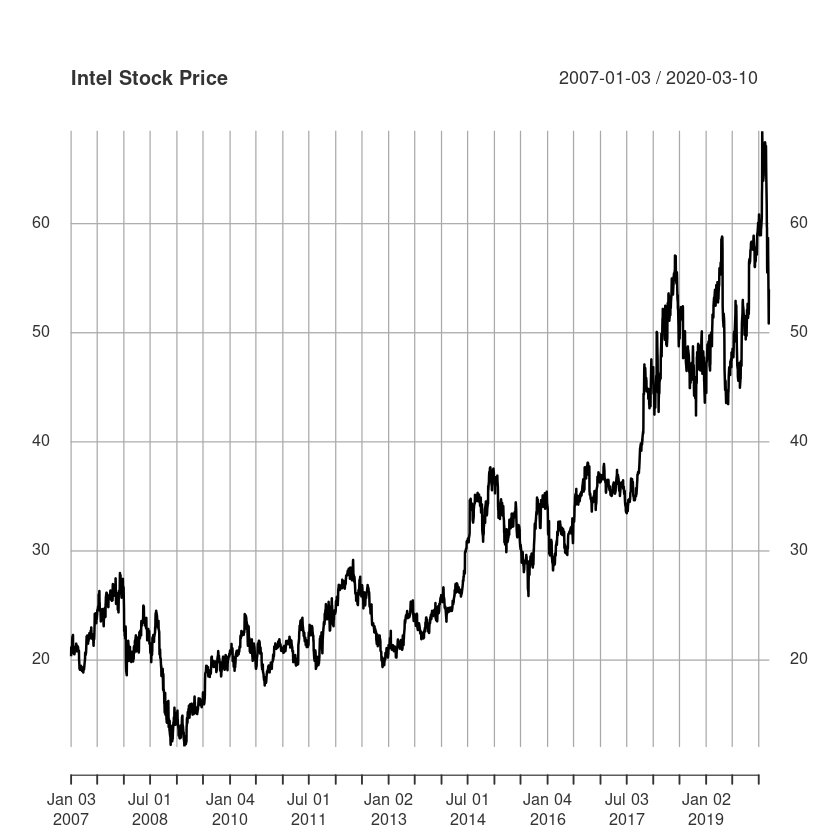
How to plot data from Yahoo finance with R
plot(df_intc$INTC.Close,main = 'Intel Stock Price')
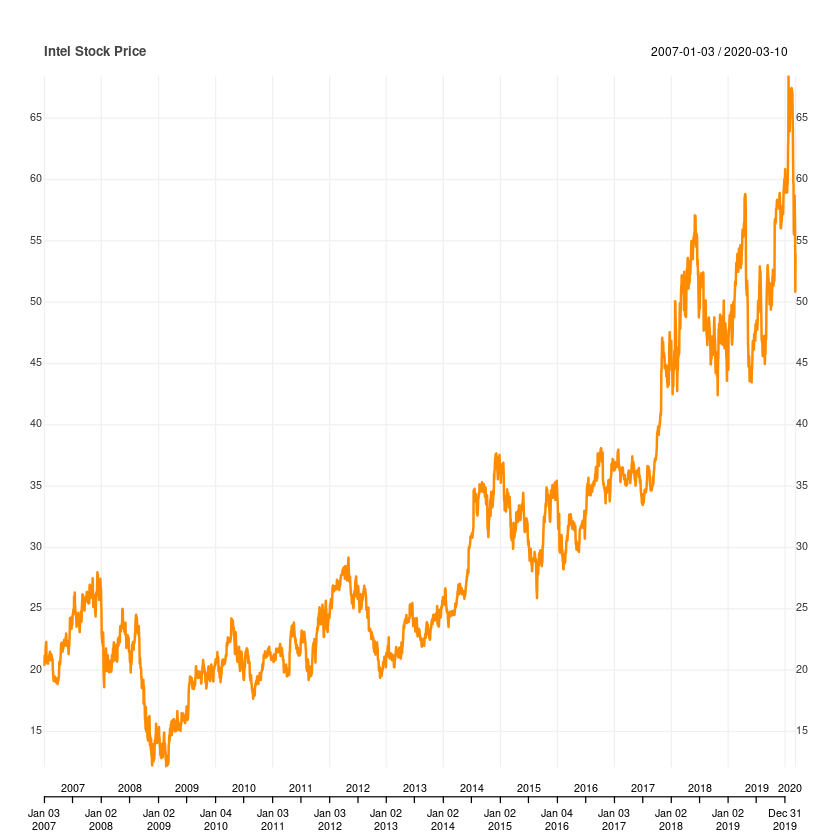
quantmod has chart_series method which we can use also to plot in R.
chart_Series(df_intc$INTC.Close,name="Intel Stock Price")
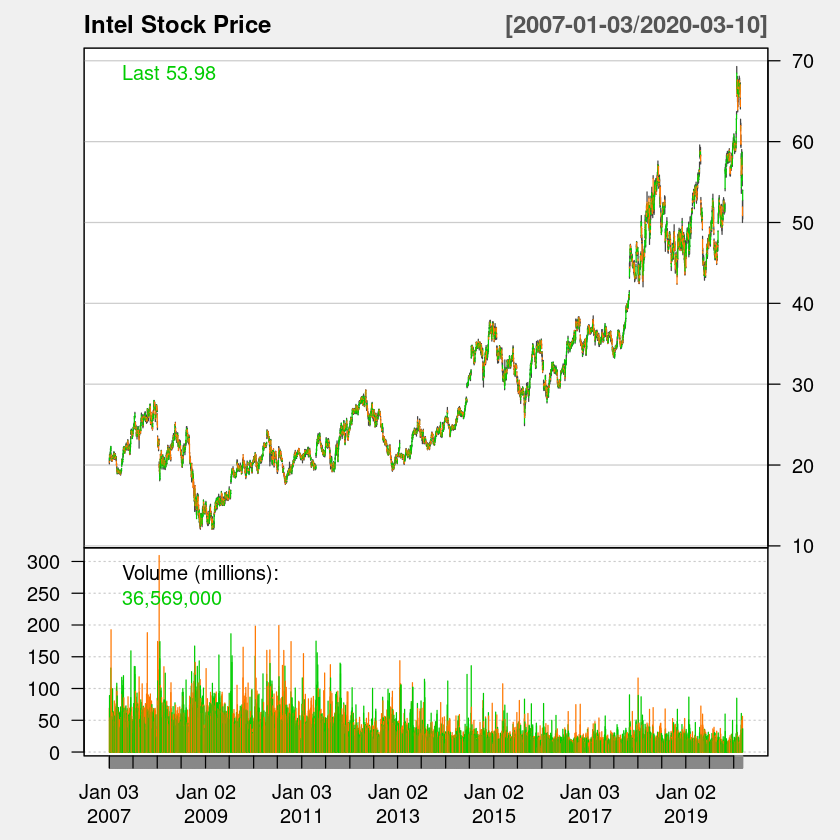
How to draw candlestick Chart with R
To draw candlestick chart we will have to feed in all the columns to chartSeries package. Note chartSeries is different from chart_series.
chartSeries(df_intc,name="Intel Stock Price",theme = 'white')
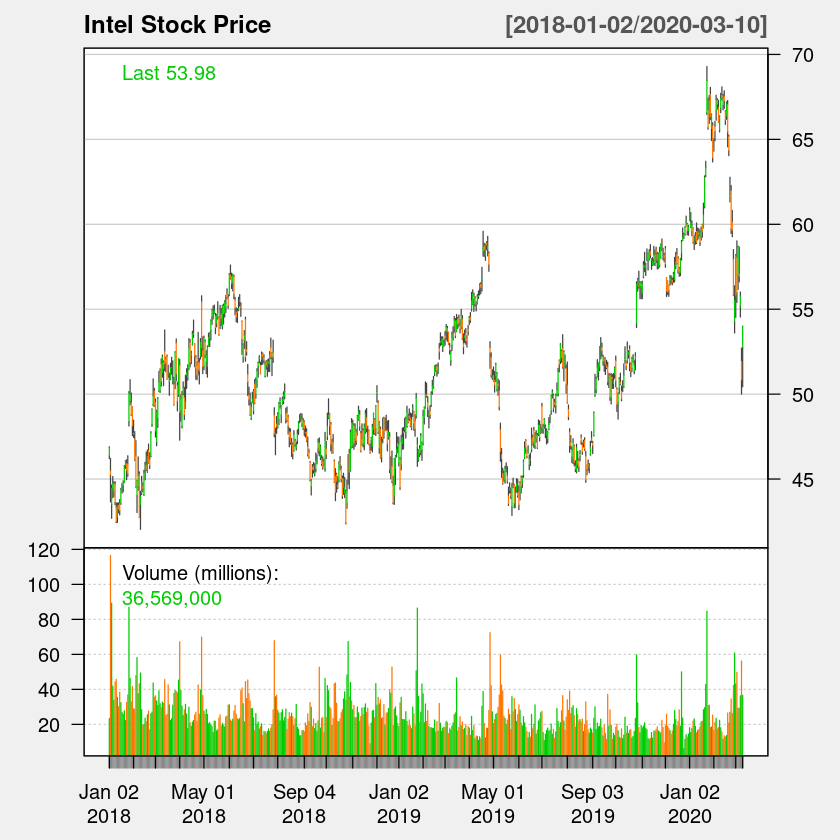
We can also plot part of time series using subset option of chartSeries package in R. Let us say we want to plot only data from 2018 to 2020, we can specify it using subset='2018::2020'
chartSeries(df_intc,name="Intel Stock Price",theme = 'white',subset='2018::2020')
Related Notebooks
- How To Parse Yahoo Finance News Feed With Python
- How To Analyze Data Using Pyspark RDD
- Calculate Stock Options Max Pain Using Data From Yahoo Finance With Python
- Pandas Datareader To Download Stocks Data From Google And Yahoo Finance
- How to Analyze the CSV data in Pandas
- How To Analyze Wikipedia Data Tables Using Python Pandas
- How To Read JSON Data Using Python Pandas
- Data Cleaning With Python Pdpipe
- Data Analysis With Pyspark Dataframe