Analyze Corona Virus Cases In India
Corona Virus Cases In India By State - last updated March 24, 2020
Below data has been copied from following site mohfw.gov.in
df.sort_values(by='Confirmed_Indian_National',ascending=False)
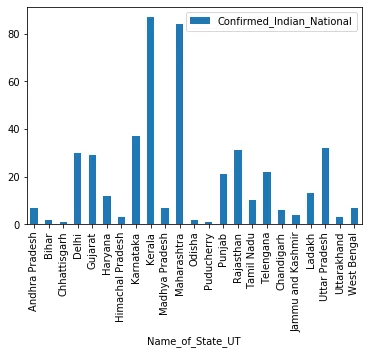
df[['Confirmed_Indian_National']].plot.bar()

df[['Confirmed_Indian_National']].plot.bar()

In this post, I have explained, how we can analyze and plot the Corona Virus Cases.
Let us import the Python Pandas packages.
import pandas as pd
import matplotlib.pyplot as plt
we need matplotlib pyplot to plot the charts.
If you have your notebook launched on Linux then, you can use cat command to look at first two rows.
!cat data/india_corona_virus_cases.csv | head -2
Other wise Pandas way is using head() method as shown below.
df_india = pd.read_csv('data/india_corona_virus_cases.csv',encoding='UTF-8')
df_india.head()
Lets drop the redundant column Sno from our data frame using the df.drop method.
df_india.drop(columns=['Sno'],inplace=True)
df_india.head(2)
Let us set the index to column 'Name_of_State_UT' using df.set_index() method.
df = df_india.set_index('Name_of_State_UT')
We can sort our data frame by the most number of domestic Corona virus cases per state in India. Let us use pandas sort_values method to which we can feed the column by which we want to sort as shown below.
df.sort_values(by='Confirmed_Indian_National',ascending=False).head(2)
Let us check how many total domestic cases in India so far.
df.Confirmed_Indian_National.sum()
How about foreign national Corona Virus cases in india.
df.Confirmed_Foreign_National.sum()
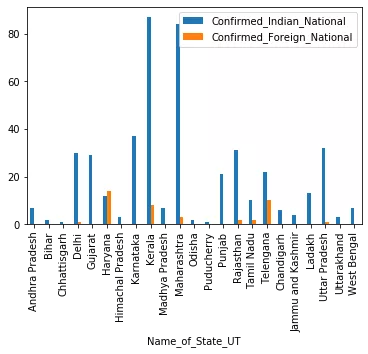
Lets us plot few bar plots to visualize the Corona Virus cases in India.
df[['Confirmed_Indian_National']].plot.bar()
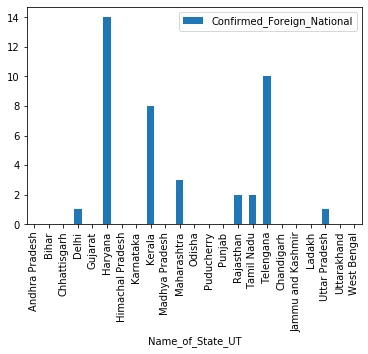
df[['Confirmed_Foreign_National']].plot.bar()
df[['Confirmed_Indian_National','Confirmed_Foreign_National']].plot.bar()