Boxplots In R
Last Updated 2020-05-17Box plots are pretty straightforward to plot.
boxplot syntax in R is boxplot()
Box plots in R fall in to following categories.
- Single Box Plot In R
- Multiple Box Plots In R
For this tutorial, I will use stocks data which i downloaded from Kaggle.
Let us read our csv file for stock "Google" and convert the data in to dataframe.
stock.data <- read.csv('data/individual_stocks_5yr/individual_stocks_5yr/GOOGL_data.csv')
stock.data.df <- data.frame(stock.data)
Let us look at first two rows of our stock data.
head(stock.data.df,2)
Ok, Let us draw the box plot for high price.
boxplot(stock.data.df$high)
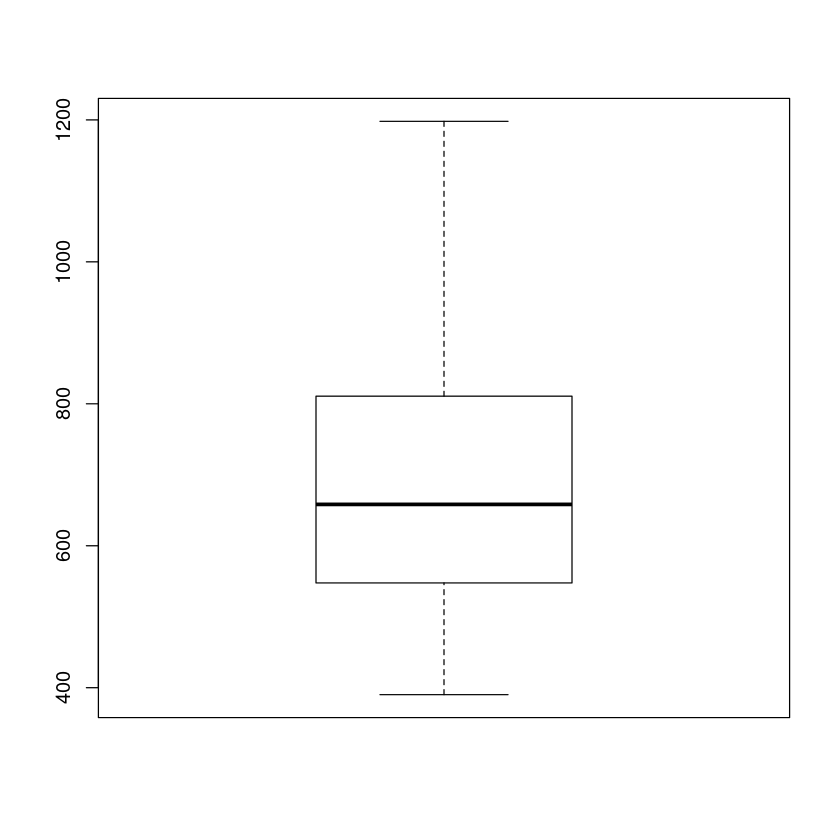
Box plots show us the summary of data. There are 5 important points to note down in box plot.
Minimum : the lowest data point excluding any outliers.
Maximum : the largest data point excluding any outliers.
Median (Q2 / 50th Percentile) : the middle value of the dataset.
Body : 25%-75% percentile value of the dataset.
Whiskers: vertical lines outside the body above and below are called whiskers.
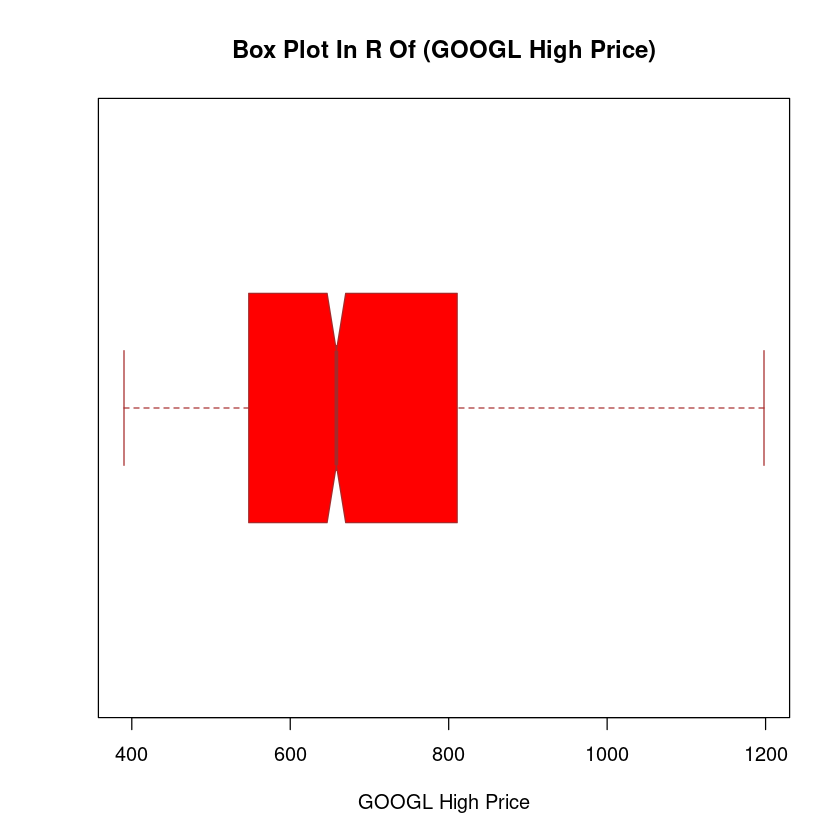
How to plot horizontal Boxplot in R
To rotate the direction, just pass an option, horizontal = TRUE to the boxplot function. We can also control color and mention many other options such as xlab for x axis labeling, ylab for y axis labeling etc. Please do help(text) to find more about other options.
boxplot(stock.data.df$high,main = "Box Plot In R Of (GOOGL High Price)",
xlab = "GOOGL High Price",
col = "red",
border = "brown",
horizontal = TRUE,
notch = TRUE)
Multiple Boxplots in R
Let us say, we want to draw box plots for close, open, high and low prices all in one graph. This is how we do it...
close <- stock.data.df$close
open <- stock.data.df$open
high <- stock.data.df$high
low <- stock.data.df$low
bplot <- boxplot(open,close,high,low,names = c("open","close","high","low"),main="Multiple Boxplots in R")
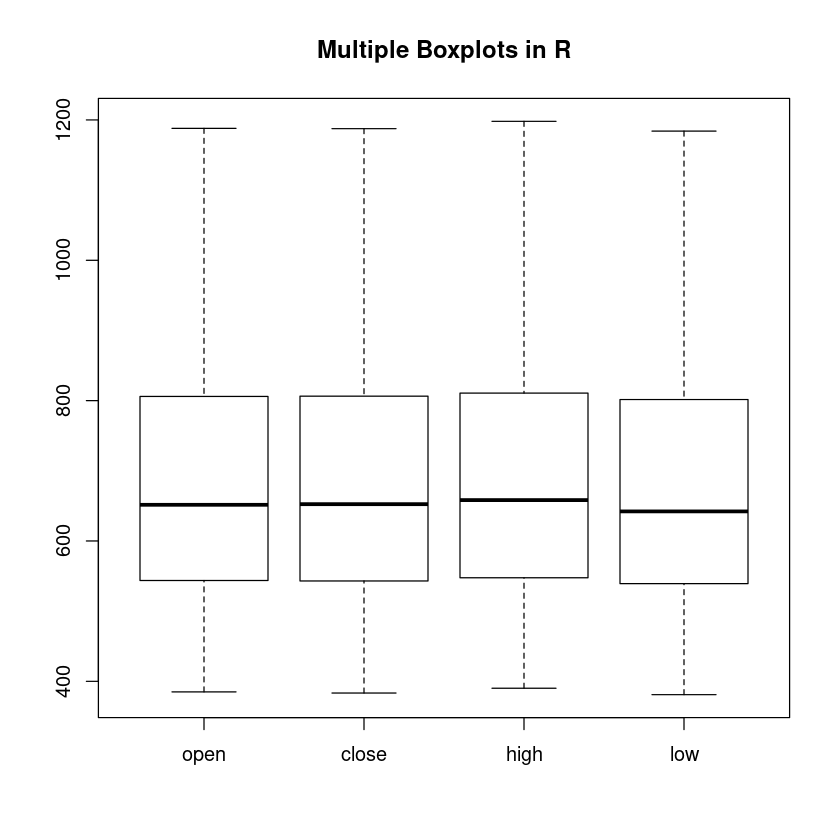
It is easy to compare data against multiple variables when we draw multiple boxplots in the same graph. As we can see above, all the variables have pretty much the same median and range.
However, we can also print the values of each box plot by using boxplot.stats function.
Let us check the boxplot stats for close price.
boxplot.stats(close)$stats
Starting from left to right: Above entries are min, low, median, high and max respectively.
How to add text to multiple boxplots in R
Let us see if we can show these values on the boxplot itself. To do that, we will have to use text() function which takes above stats values. Check out the code below.
close <- stock.data.df$close
open <- stock.data.df$open
high <- stock.data.df$high
low <- stock.data.df$low
close_stats = boxplot.stats(close)$stats
open_stats = boxplot.stats(open)$stats
high_stats = boxplot.stats(high)$stats
low_stats = boxplot.stats(low)$stats
bplot <- boxplot(open,close,high,low,names = c("open","close","high","low"))
text(y=open_stats,labels=c(open_stats),x=1)
text(y=close_stats,labels=c(close_stats),x=2)
text(y=high_stats,labels=c(high_stats),x=3)
text(y=low_stats,labels=c(low_stats),x=4)
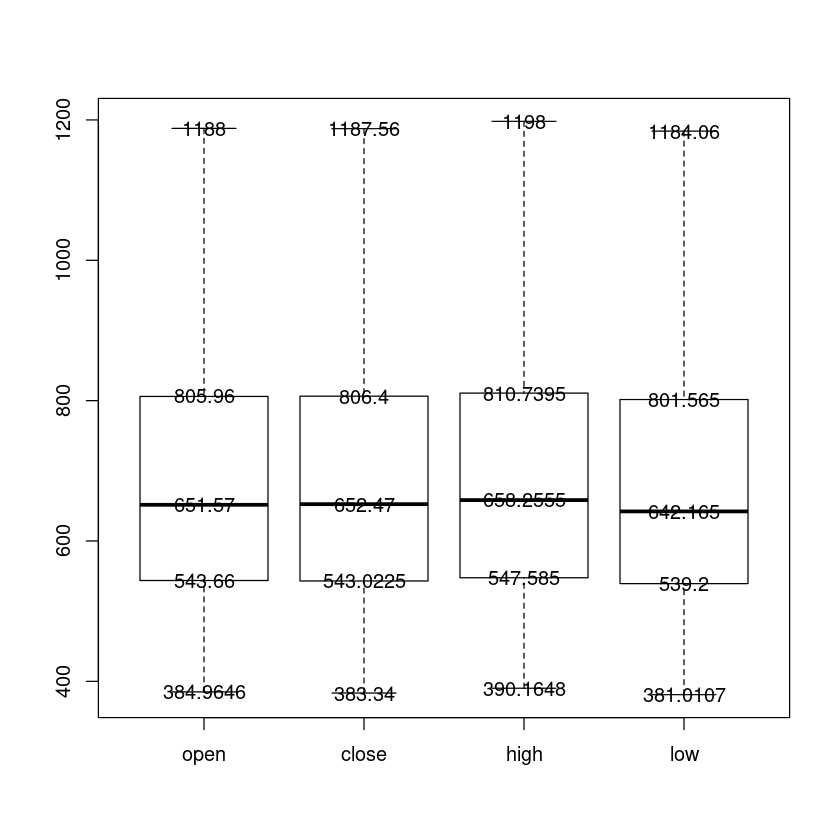
Note: in text() function y are the values from boxplot.stats() function and x denotes the indexing or positioning of individual box plots.
Wrap Up!
I hope this tutorial has exposed you enough to explore more about R boxplots.