Top Non Javascript Boxplot Libraries In R With Examples
Last Updated 2020-05-17In this tutorial, i will talk about some of the best libraries for drawing boxplots in R.
- boxplot() R native
- bwplot() Lattice
- ggplot() Ggplot2
For this tutorial, I will use stocks data which i downloaded from Kaggle.
Let us read our csv file for stock Google and convert the data in to dataframe.
stock.data <- read.csv('data/individual_stocks_5yr/individual_stocks_5yr/GOOGL_data.csv')
stock.data.df <- data.frame(stock.data)
head(stock.data.df,2)
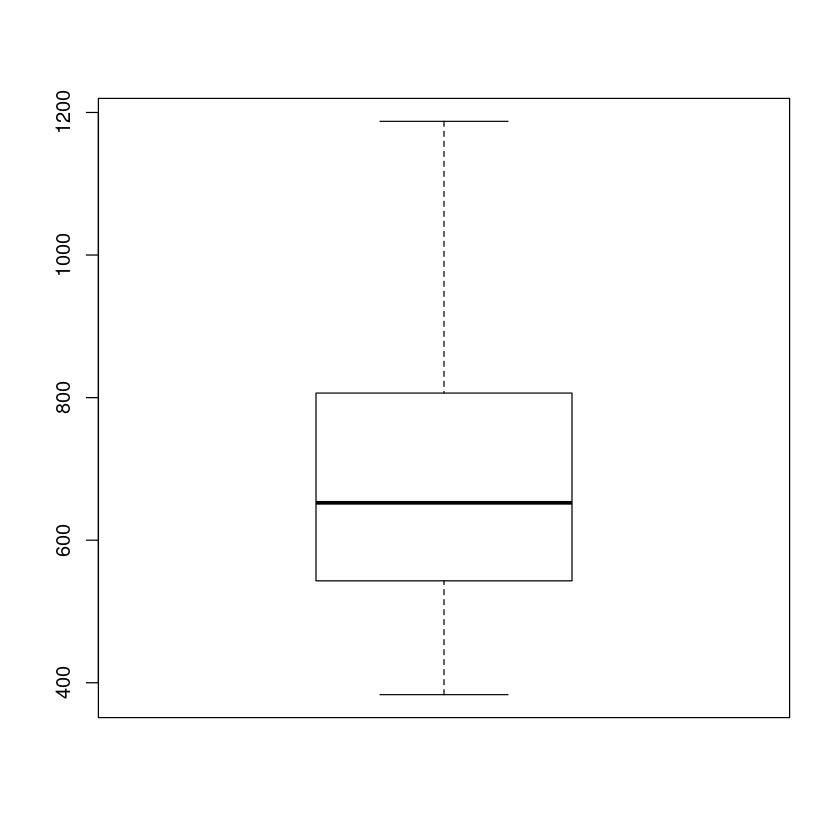
R Boxplot
boxplot() is native library in R and it is very easy to use. Checkout boxplots in R for more details.
boxplot(stock.data.df$close)
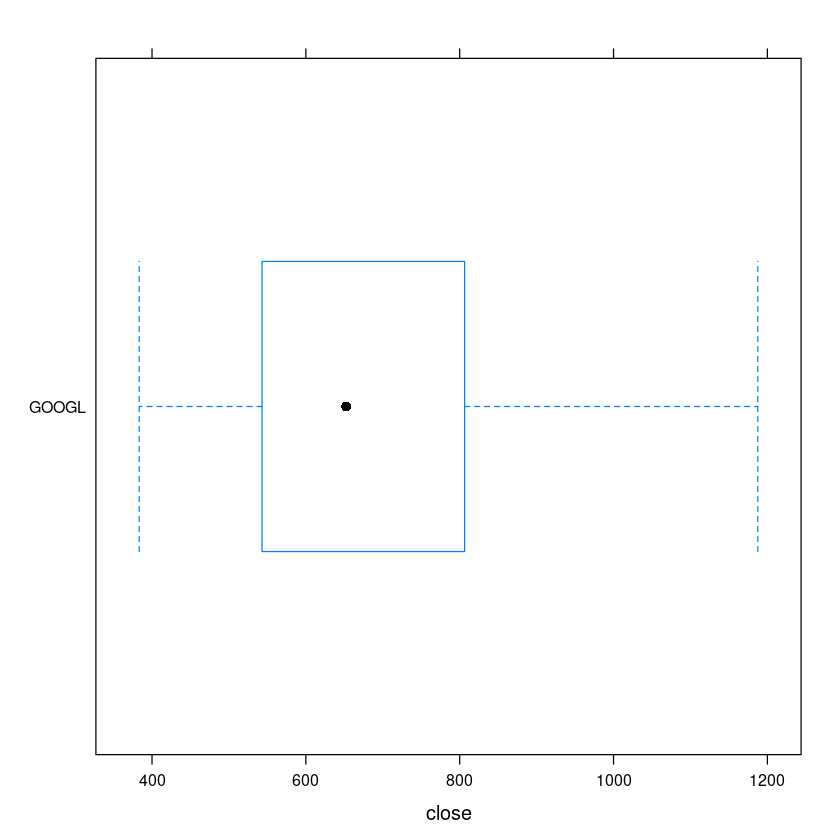
Boxplot using Lattice
If you don't have it installed, install it using install.package('lattice') in R repl or R studio.
library(lattice)
We can draw the plot using bwplot() function.
bwplot(Name~close,data=stock.data.df)
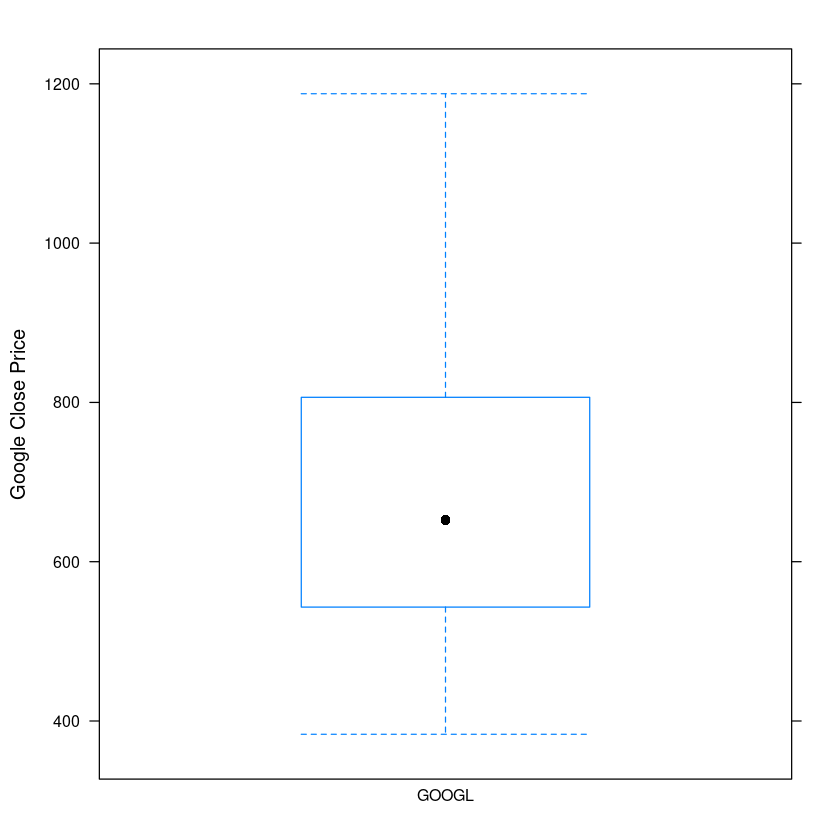
We can rotate the plot, if we reverse the order in bwplot() function as shown below.
bwplot(close~Name,data=stock.data.df,ylab='Google Close Price')
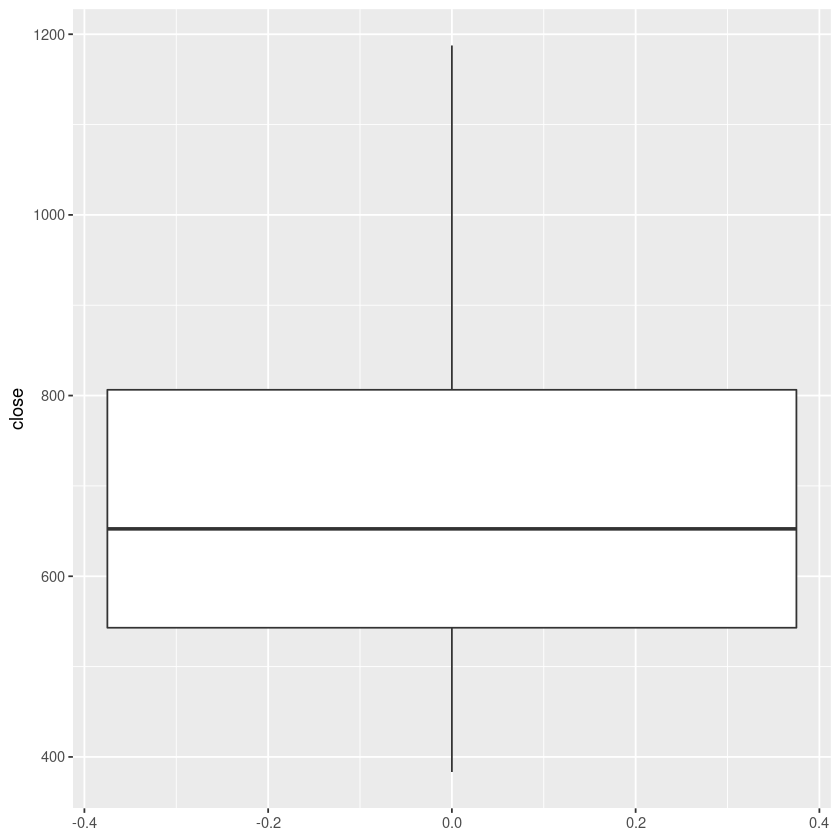
Boxplot in Ggplot2
Install ggplot2 in R repl or Rstudio with install.packages('ggplot2')
library(ggplot2)
ggplot(stock.data, aes(y=close)) +
  geom_boxplot()
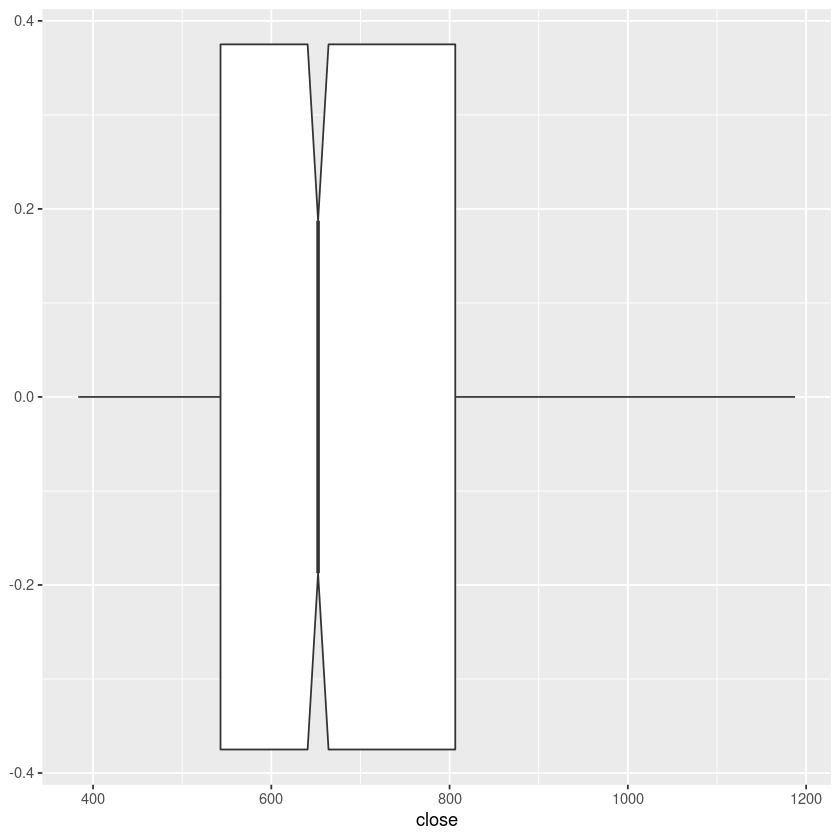
ggplot(stock.data, aes(y=close)) +
  geom_boxplot(notch = TRUE) + coord_flip()
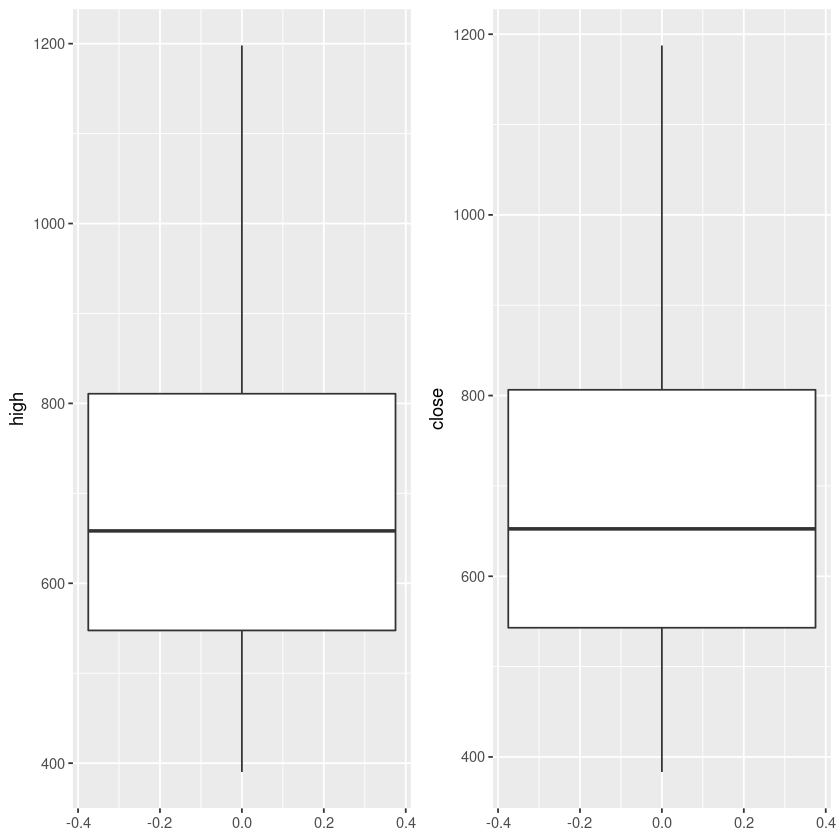
We can draw multiple box plots side by side with package gridExtra. Install it using install.packages('gridExtra')
library(gridExtra)
gghigh <- ggplot(stock.data.df, aes(y=high)) +  geom_boxplot()
ggclose <- ggplot(stock.data.df, aes(y=close)) +  geom_boxplot()
grid.arrange(gghigh,ggclose,ncol=2)
Wrap Up!
Let me know if you know of any good R non javascript library packages by emailing me at johnludhi at outlook.com. I will cover it here.