Polynomial Interpolation Using Python Pandas, Numpy And Sklearn
In this post, We will use covid 19 data to go over polynomial interpolation.
Before we delve in to our example, Let us first import the necessary package pandas.
import pandas as pd
from matplotlib import pyplot as plt
import numpy as np
df=pd.read_csv('covid19_us_states.csv',encoding='UTF-8')
df is a datraframe which contains time series covid 19 data for all US states. Let us take a peak in to the data for California.
df[df.state=='California'].head(2)
Let us covert the date in to Python datetime object and set the index as date.
df['date'] = pd.to_datetime(df['date'])
df.set_index('date',inplace=True)
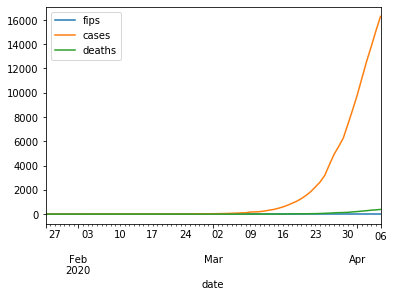
Let us do a line plot for covid 19 cases of California.
df[df.state=='California'].plot.line()
Polynomial Interpolation Using Sklearn
We would need Ridge, PolynomialFeatures and make_pipeline to find the right polynomial to fit the covid 19 California data.
Ridge is a l2 regularization technique. PolynomialFeatures generates polynomial and interaction features. make_pipeline is a function to build the pipeline.
from sklearn.linear_model import Ridge
from sklearn.preprocessing import PolynomialFeatures
from sklearn.pipeline import make_pipeline
X = np.array(range(len(df[df.state=='California'].index))).reshape(-1,1)
y = df[df.state=='California']['cases']
models = []
for count, degree in enumerate([1, 2, 3]):
    model = make_pipeline(PolynomialFeatures(degree), Ridge(alpha=0.001))
    model.fit(X, y)
    models.append(model)
    y_pred = model.predict(X)
    plt.plot(X, y_pred, linewidth=2, label='degree %d' % degree)
plt.legend(loc='upper left')
plt.scatter(X, y, s=20, marker='o', label='training points')
plt.show()
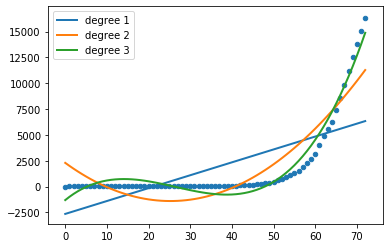
In the above code, we can see polynomials of degree 1, 2 and 3. As we see polynomial of degree 3 matches very close to the real data.
Related Notebooks
- Covid 19 Curve Fit Using Python Pandas And Numpy
- How to do SQL Select and Where Using Python Pandas
- Select Pandas Dataframe Rows And Columns Using iloc loc and ix
- Convert Pandas DataFrame To Numpy Arrays
- Python Numpy Where
- Stock Tweets Text Analysis Using Pandas NLTK and WordCloud
- Summarising Aggregating and Grouping data in Python Pandas
- Merge and Join DataFrames with Pandas in Python
- Numpy Basics