How To Plot Unix Directory Structure Using Python Graphviz
Graphviz is great library for visualizing connections between any network. In this notebook, I will show you how to plot Unix directory structure using Graphviz. There is a Python package python-graphviz which I will use to plot using Python.
Let us first install the required packages.
Install Python Graphviz
pip install pydot3 graphviz
Above command will install following two packages.
graphviz pkgs/main/linux-64::graphviz-2.40.1-h21bd128_2
python-graphviz pkgs/main/noarch::python-graphviz-0.15-pyhd3eb1b0_0
Plot Unix Directory Structure Using Graphviz
For example, let us plot subdirectories and files inside subdirectories only. Let us first check the sub directories using Unix find command.
!find /etc/nginx/ -type d
So for this example we are plotting the following tree - root directory, subdirectory and files inside subdirectories not the files inside root directory because there are many files inside the root directory and our graph will be too cluttered if we plot everything.
Import the following packages.
import pydot
import os
from IPython.display import Image, display
rootdir = "/etc/nginx"
The below code, creates Graph node and add to Graph object the root directory.
G = pydot.Dot(graph_type="digraph")
node = pydot.Node(rootdir.split("/")[-1],style="filled",fillcolor="green")
G.add_node(node)
Let us plot the tree containing root directory.
im = Image(G.create_png())
display(im)

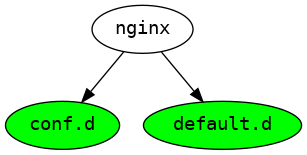
Ok so far so good. Let us plot the tree again with all the sub directories in it. Notice the command pydot.Edge in the below snippet. pydot.Edge will create the edge which will connect the child node to its parent node. G.add_edge() will add the edge to graph.
G = pydot.Dot(graph_type="digraph")
for root, dirs, files in os.walk(rootdir):
    for subdir in dirs:
        node = pydot.Node(subdir,style="filled",fillcolor="green")
        G.add_node(node)
        edge = pydot.Edge(root.split("/")[-1],subdir)
        G.add_edge(edge)
im = Image(G.create_png())
display(im)
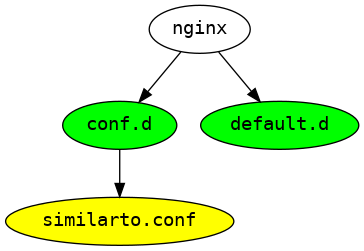
Ok, Now moving on to next level. Let us plot the tree containing - root directory, subdirectories and sub directories files.
In the below snippet, I have added an extra loop to add the files to the Graphviz tree.
G = pydot.Dot(graph_type="digraph")
for root, dirs, files in os.walk(rootdir):
    for subdir in dirs:
        node = pydot.Node(subdir,style="filled",fillcolor="green")
        G.add_node(node)
        edge = pydot.Edge(root.split("/")[-1],subdir)
        G.add_edge(edge)
    if root==rootdir:
        continue
    for file in files:
        node = pydot.Node(file,style="filled",fillcolor="yellow")
        G.add_node(node)
        edge = pydot.Edge(root.split("/")[-1],file)
        G.add_edge(edge)
The below command graph shows only the files inside the sub directories. This is because i am skipping the files from the root directory using following code...
if root==rootdir: continue
im = Image(G.create_png())
display(im)
For the sake of completeness, Let us plot everything inside nginx directory.
G = pydot.Dot(graph_type="digraph")
for root, dirs, files in os.walk(rootdir):
    for subdir in dirs:
        node = pydot.Node(subdir,style="filled",fillcolor="green")
        G.add_node(node)
        edge = pydot.Edge(root.split("/")[-1],subdir)
        G.add_edge(edge)

    for file in files:
        node = pydot.Node(file,style="filled",fillcolor="yellow")
        G.add_node(node)
        edge = pydot.Edge(root.split("/")[-1],file)
        G.add_edge(edge)
im = Image(G.create_png())
display(im)

Related Notebooks
- How to Plot a Histogram in Python
- How To Plot Histogram In R
- Plot Stock Options Vega Implied Volatility Using Python Matplotlib
- How to Visualize Data Using Python - Matplotlib
- How To Read CSV File Using Python PySpark
- How To Read JSON Data Using Python Pandas
- How To Analyze Wikipedia Data Tables Using Python Pandas
- How To Solve Linear Equations Using Sympy In Python
- How to do SQL Select and Where Using Python Pandas